Queries DevOps: Saved Queries for Management Reports
Other
Queries DevOps: Saved Queries for Executive Reports | Syneo
Executive reports based on saved queries: fixed definitions, system-of-record decisions, and automated DORA-based KPIs for reliable, auditable management.
saved queries, DevOps, executive reports, DORA, KPIs, CI/CD, observability, data integration, Jira, data quality
April 2, 2026

The problem with management reports is that they’re rarely bad because there’s no data. They’re bad because we calculate something different every week, piecing it together manually in Excel using questionable definitions. In a DevOps environment, this is particularly painful because delivery and operations data reside in multiple systems (ticketing, CI/CD, logs, monitoring, incident management).
The solution is often not a new BI tool, but a well-organized foundation: saved queries, saved filters, and analytics views, along with an automated executive reporting suite built on top of them. In this article, I’ll show you how to implement a DevOps approach to queries so that management can answer the same questions every week using the same logic, without any disputes.
What does “saved query” mean in the context of DevOps?
A saved query is a reusable, named, and shareable query for your data. Depending on the device you're using, it can take several forms:
Jira: Saved filters (JQL) and dashboard gadgets
Azure DevOps: Shared Queries (WIQL) and Analytics View + OData
GitLab/GitHub: searches, reports, API-based queries
Observability: Grafana dashboards, Prometheus (PromQL), log queries (KQL, Lucene)
Data Warehouse: SQL views, materialized views, dbt models
The bottom line: you need to understand the definition, not just glance at the result once.
Why is saved queries a key topic?
A good management report isn’t a “little bit of everything,” but rather consistent answers to 6–10 standard questions. Saved queries provide value at the management level for three reasons:
Predictability: the same definition runs with the same time window.
Auditability: You can trace what your calculations were based on, when they were made, and what has changed.
Self-service: Management does not open a ticket to request data because the dashboard and drill-down features are functional.
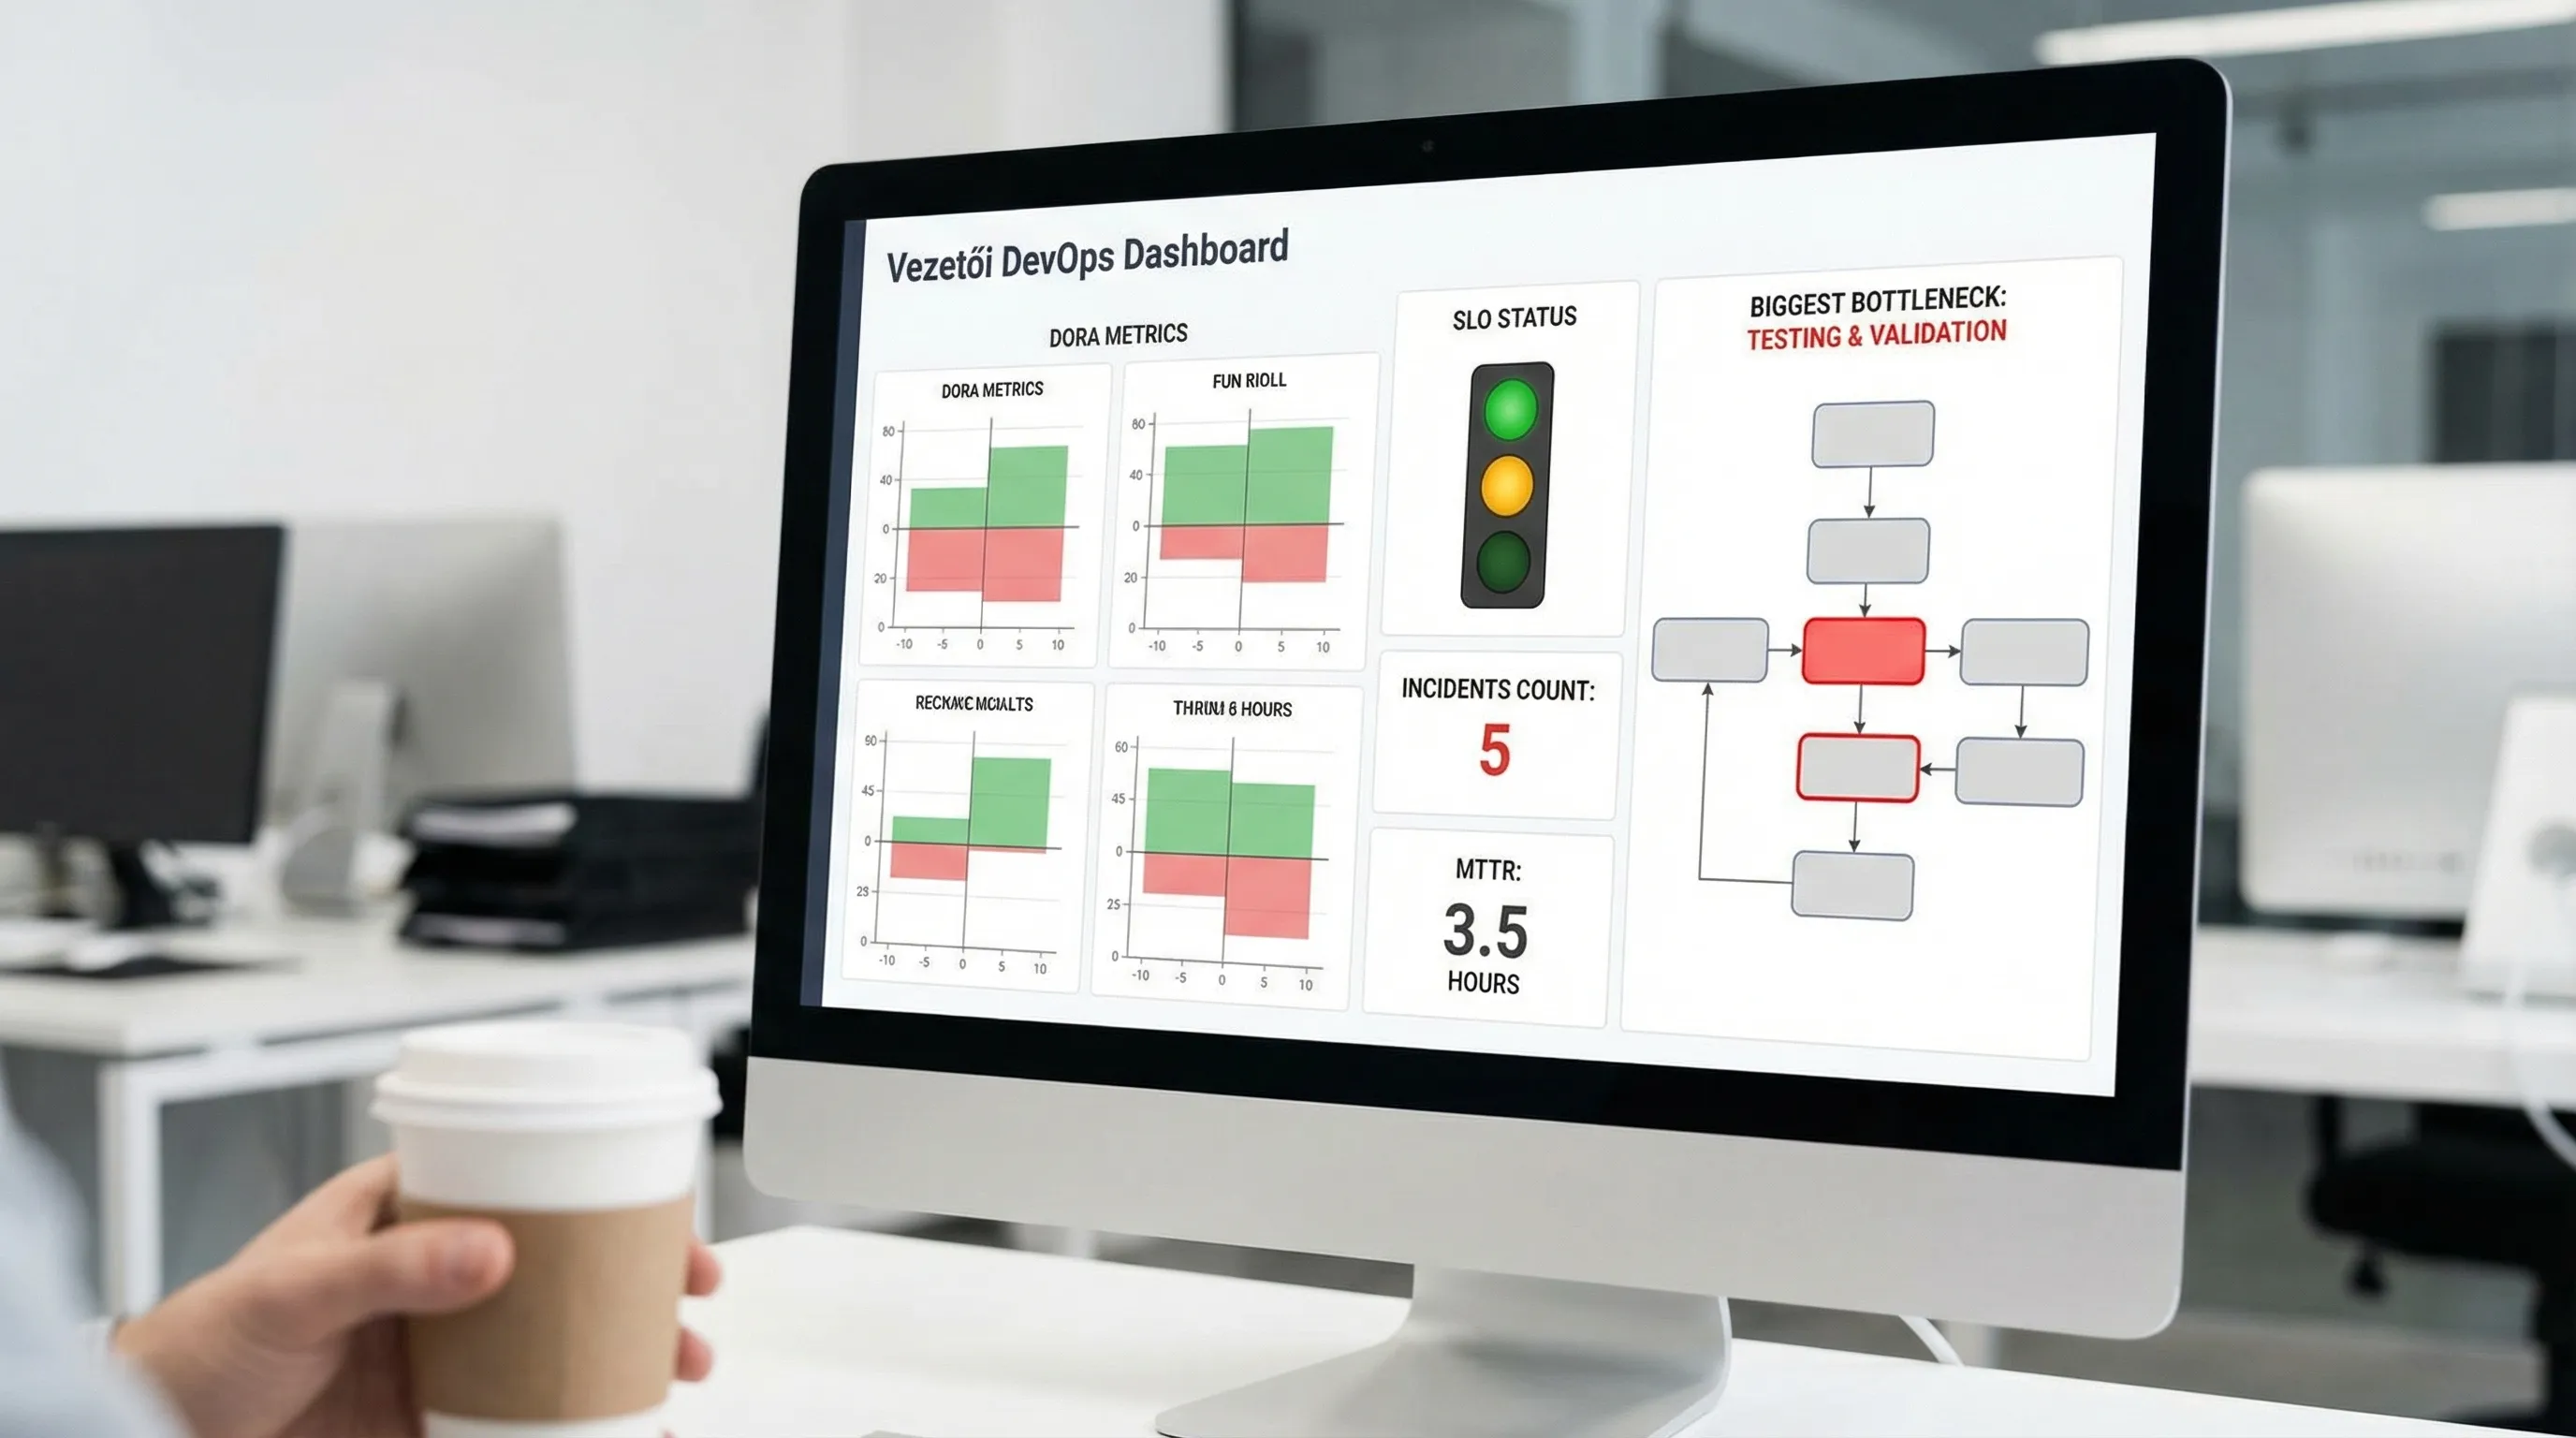
If you want to measure DevOps, the DORA research (deployment frequency, lead time for changes, change failure rate, time to restore) provides a solid starting point. The summaries of the DORA research offer a good overview of the background of the DORA metrics.
Step 1: Document the leadership questions (not the metrics)
Most reports go off track because they start with metrics. It’s more effective to begin this way:
Can we deliver reliably according to the roadmap?
Has spending picked up or slowed down over the past four weeks?
Has the risk of errors (incidents, rollbacks, hotfixes) increased?
Where is the work currently at (review, testing, release approval, environment)?
What are the top 3 system risks that could affect a business (SLA, capacity, security)?
You’ll assign KPIs and queries to these later. Syneo’s article, “DevOps Framework for SMEs: Roles and KPIs,” provides a solid, SME-friendly foundation for KPIs and roles.
Step 2: Decide what your "system of record" is
In a management report, it is unacceptable for the same term to have different meanings in two different places.
Typical decisions that need to be communicated:
Does “done” refer to the Jira Done status or the production deployment?
Does "release" refer to the successful execution of the pipeline or the approval of the change record?
Is the time of the incident the time the alert was triggered, the time the ticket was opened, or the time reported by the customer?
DevOps data is often scattered across various sources, so it’s frequently a good idea to incorporate an integration layer, a data warehouse, or a lakehouse. Related reading: System Integration: How to Connect ERP, CRM, and BI.
Step 3: Create a "definition sheet" for each interview question
A saved query will prevent disputes only if the definition is clear. The minimum fields you should include are:
Name (for business purposes): for example, “Number of changes deployed, prod, weekly”
Time window and time zone
Exclusions: for example, maintenance windows, test environments, backfill deployments
Entity: What is the unit of measurement (deploy, change, ticket, PR, build)
Slicing: team, application, business domain, environment
Next comes the saved query.
Step 4: Create a saved query package for management reports
The table below provides a standard "management question → query" mapping. The examples illustrate tool-independent logic; the specific implementation depends on the stack.
Management issue | Recommended KPIs | Typical data source | Type of saved query |
How much did we ship? | Number of deployments to the production environment (weekly) | CI/CD, release log | Filter pipeline runs (prod, success) |
How quickly will the change go live? | Lead time for changes | Git + CI/CD + ticket | Aligning PR merge times and production deployment times |
Has the risk of errors increased? | Change failure rate | Incident, rollback, hotfix | Incident/rollback ratio associated with deployments |
How long will the recovery take? | MTTR | Incident ticketing + monitoring | Calculating incident start and end times |
Where does the work stop? | WIP, cycle time per step | Ticket workflow | Time spent in transitional statuses |
What threatens the SLA? | SLO status, error budget burn | Observability | SLO metrics (latency, error rate) |
Examples of saved queries (templates)
The following are templates. The goal is to help you determine what kinds of queries are worth "saving" and naming.
Jira (JQL) example: "Closed issues in the last 7 days, production impact"
Documentation: JQL (Atlassian)
Azure DevOps (WIQL) example: “Ready User Stories in a Sprint”
Documentation: WIQL (Microsoft)
Prometheus (PromQL) example: "5xx error rate for prod API (5 minutes)"
Documentation: PromQL (Prometheus)
Example of a log query (KQL-style): "Trend of timeouts associated with incidents"
In the KQL world, the specific syntax depends on the platform (such as Azure Monitor or Sentinel), but the example clearly illustrates filtering, aggregation, and time-series processing.
Step 5: Create a "report" from the saved queries
A management report is more than just a chart. A well-structured report typically consists of three layers:
1) Overview for Managers (5 minutes)
DORA trend (4 weeks) and comparison to target
SLO status (green-yellow-red)
Top 3 Risks (brief summary)
2) Drill-down (15 minutes)
Team or system breakdown
Bottleneck view (where cycle time increased)
Incidents broken down by cause (deployment-related, infrastructure, vendor)
3) Operational To-Do List (30 minutes)
What we'll be fixing over the next 1–2 weeks
What requires a decision or resources
What do we measure after the fix (specific, predefined query)
This is where the difference lies between a "nice dashboard" and a "management tool."
Step 6: Treat queries like code
If the report is business-critical, then the saved query is too. Proven DevOps best practices worth adopting:
Versioning: Keep the query definition in the repository (export, JSON, SQL view, dbt model)
Review: Changes may only be made after the review (especially regarding KPI definitions)
Environments: if there is a staging BI, test there (time window, duplication, missing fields)
Naming convention: for example
exec_weekly_deploy_prod_successdescriptive names
This goes a long way toward ensuring that the report doesn’t fall apart after six months.
Step 7: Common pitfalls that ruin management reports
Vanity metrics
The metric "how many tickets we closed" is rarely useful for management. It is much better if the saved query directly supports a decision (for example, "the rate of deployment-related incidents has increased; let's reduce the batch size").
Inconsistent time windows
If deployments are weekly, incidents are monthly, and the lead time is a 90-day average, management won’t be able to make sense of it. The time window should be standardized (for example, a 7-day and 28-day trend).
Entity mixing
Deployment, release, change, merge, ticket. If you use these terms interchangeably, the numbers will be inconsistent. Decide on a standard unit of measurement and document it in the definition sheet.
Manual exceptions that no one documents
“Don’t count this hotfix.” If there are exceptions, make sure there is a rule and a tag for them that the query handles.
Authorization and compliance issues
In executive reporting, it is common for dashboards to display too much personal data or sensitive internal information. Use data minimization, role-based access controls, and auditable access (Syneo’s various security-related materials, such as those covering NIS2 and access management, provide a general overview of this approach).
A practical, fast-track implementation schedule (2 weeks)
Once the core data systems are in place, management reports based on saved queries can be put together quickly.
Days 1–2: Documenting management issues, KPIs, and definition sheets (up to 10)
Days 3–5: Data source decisions (system of record), data segmentation, and basic data cleansing
Days 6–10: Creating saved queries (ticketing, CI/CD, incident, SLO)
Days 11–14: Dashboard and reporting cycle (weekly review, owners, action log)
If your core DevOps processes aren’t quite stable yet, it’s a good idea to first assess your maturity level. A good starting point for this is: “DevOps Maturity Assessment: Where Does Your Team Stand?” and, for an overview of the entire delivery pipeline: “DevOps Basics: From Scratch to Production.”

When is it worth bringing in outside help?
There are three typical situations where an experienced partner can make a big difference:
We need to integrate multiple tools to create a "single source of truth" (Jira + CI/CD + monitoring + ITSM)
There is already a report, but there is ongoing debate about the figures (definitions, exceptions, duplication)
There is pressure from compliance or audit requirements (access, logging, audit trail), and the report must also serve as "evidence"
In such situations, Syneo typically provides assistance through a framework for definitions and measurements, the standardization of saved queries, and integration and DevOps consulting; the goal is always to ensure that management reporting does not become an extra burden, but rather an integral part of the delivery cycle.
If your next step is to develop a stable, repeatable reporting package, it’s a good idea to start with a brief survey to quickly clarify KPIs, data sources, and definitions with the Syneo team.
